


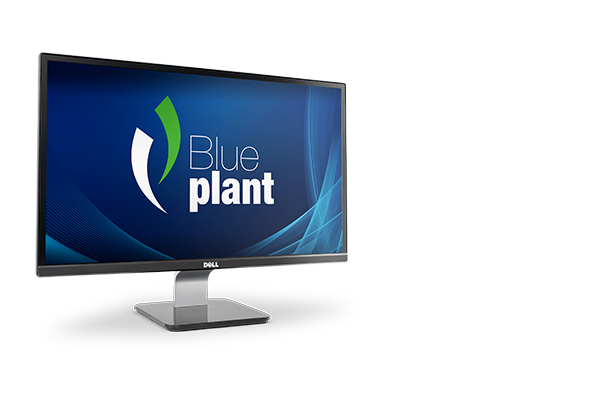


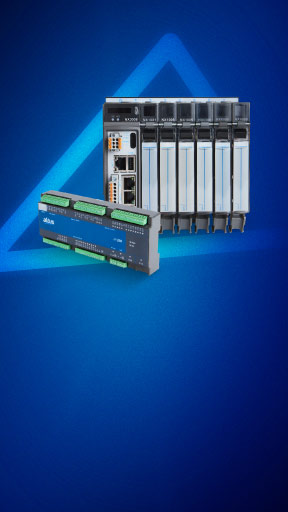
An exclusive combination of equipment that combines high performance and competitiveness to overcome the challenges of Industry 4.0
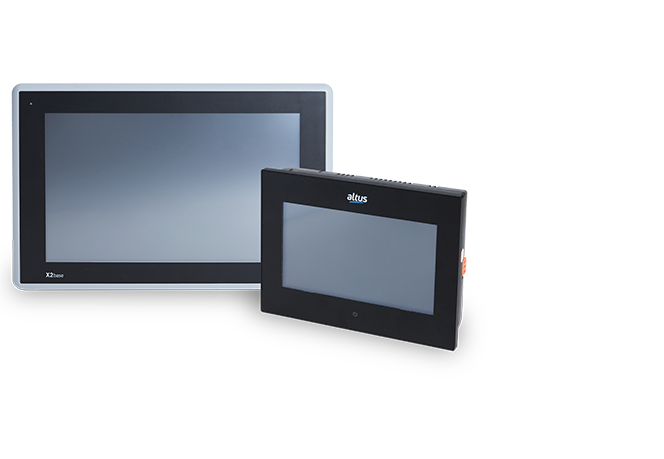
At Altus, we have the necessary know-how to provide integrated systems for the most varied demands of the industrial market

Discover our solutions and discover how our expertise can help boost your business performance
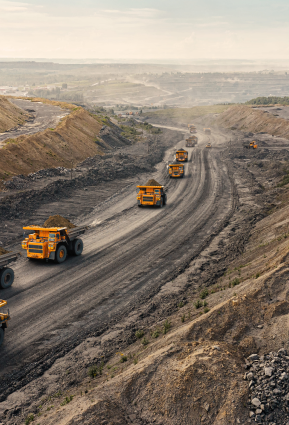
See how we have become a reference in the automation market over the course of our more than 40 years

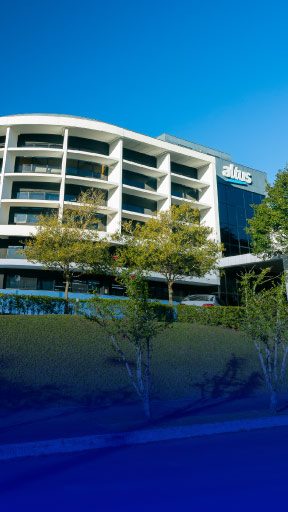
We are 100% available to solve problems, answer questions and help you optimize the performance of your application.

Get to know our units and find out where to find our sales representatives throughout Brazil